During our ramp up to factory production, I determined which of our mechanical set points were the most important for successful printing. I ran print quality studies, designed measurement jigs, wrote scripts and implemented these calibrations at our factory in China. This work allowed us to reliably hit these setpoints throughout production and ensure higher quality printing in the field.
These projects required a deep understanding of the mechanics of the printer, and which set points had a direct influence on print quality and success rate. It also required knowledge of the factory software pipeline and calibration abilities at the factory. When I began this project, I calibrated each 3D printer by hand with a dial indicator before distributing it to other engineers within the organization. After several months, I had designed an arsenal of rigs, with corresponding scripts, which ran automated calibration at our factory and logged the data for easy traceability. I additionally coordinated and ran studies to validate all of our set points while handing off the internal quality control program I had built and run. Lastly, I upgraded our factory test print and wrote an SOP for evaluation so that each printer was assured to meet the quality standards before shipping out to customers.
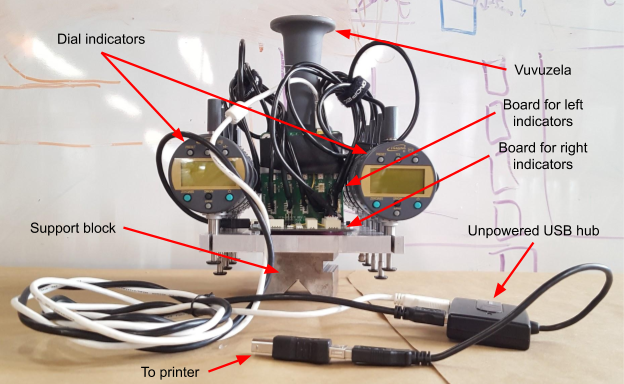
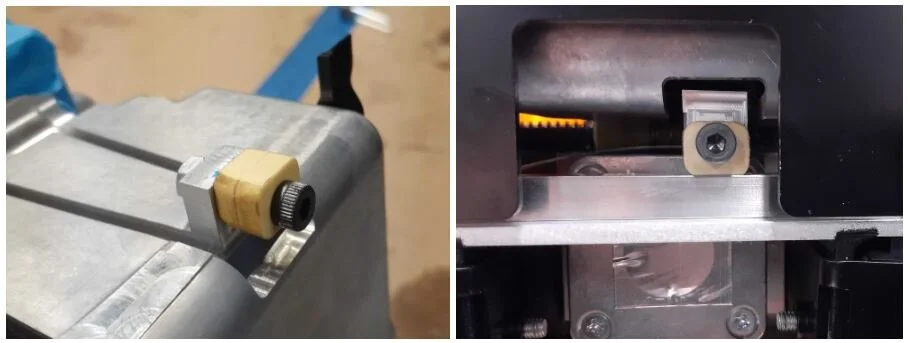
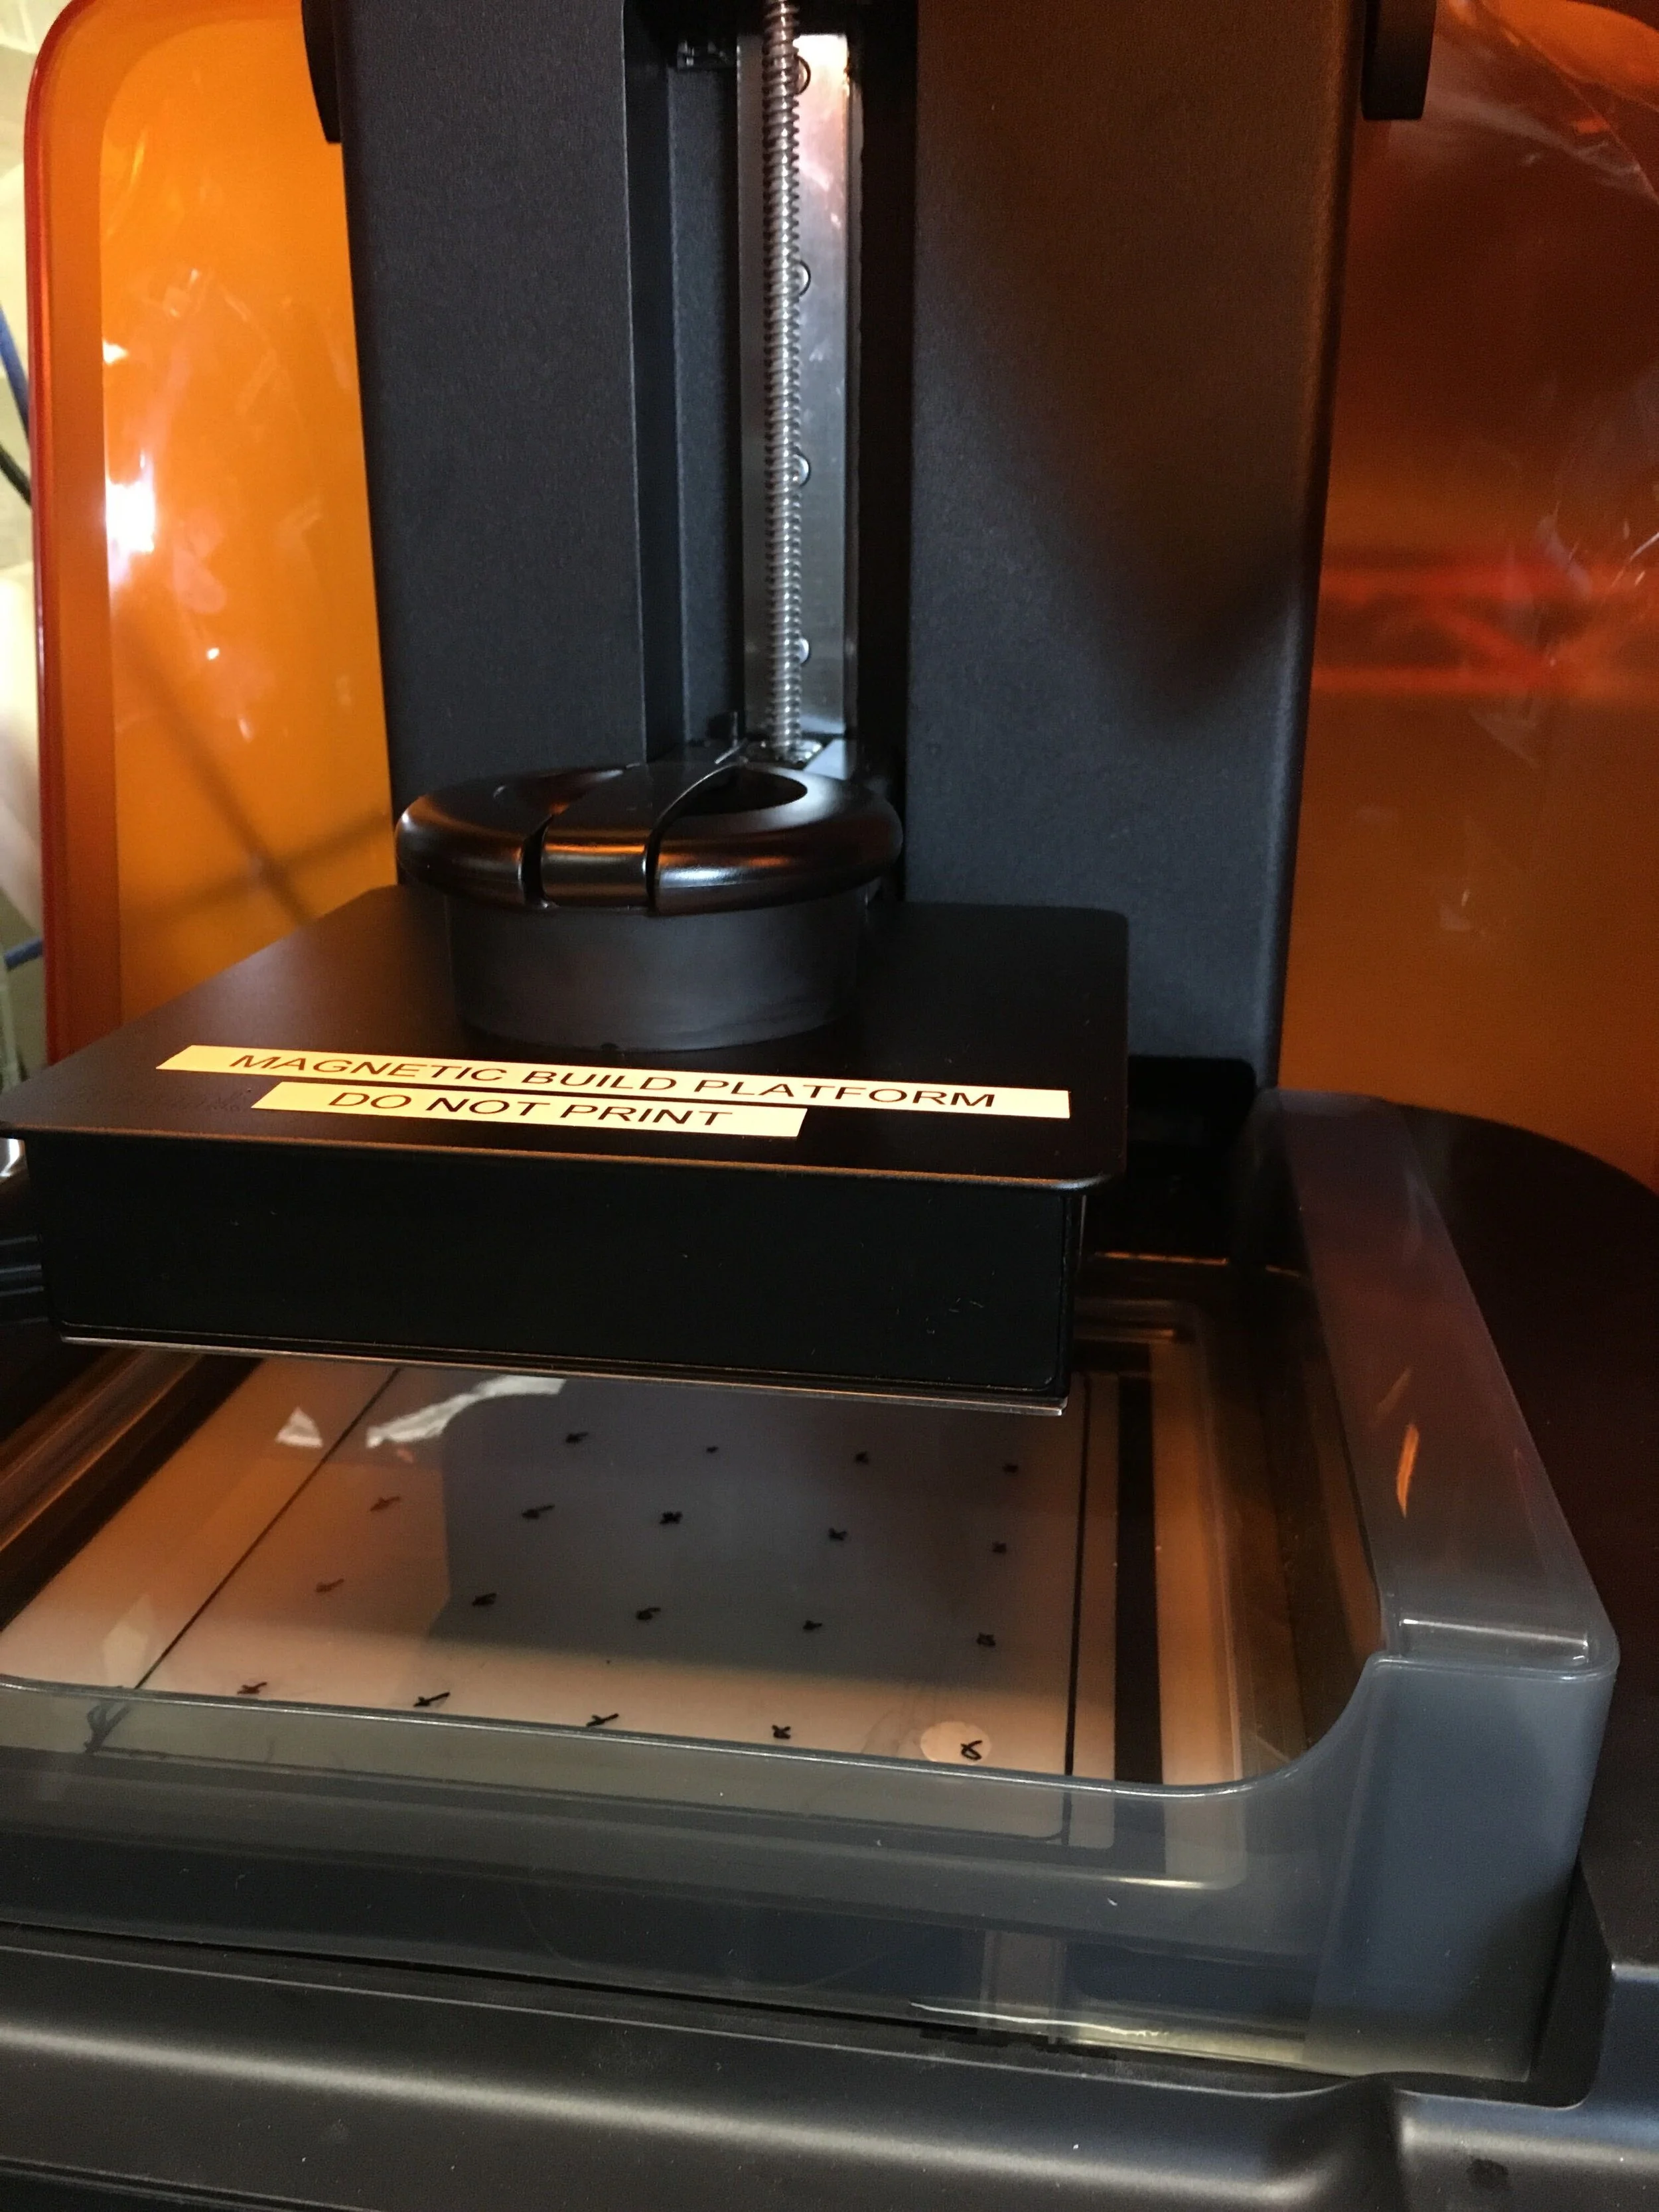
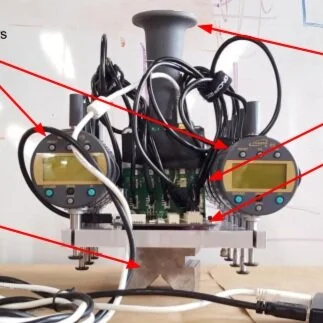
This image shows one calibration rig, it mounts to the printer and connects via USB to communicate with the factory software system. I used this rig, and designed several more, and wrote python scripts for each rig to take measurements for each critical mechanical set point .
I designed this as a proof of concept to measure the offset between our laser module and our print surface. Once I validated this design, I worked with our manufacturing team to add this calibration to our factory line. I helped them revise the design, while determining what our ideal calibration range was for both print success and factory yield, wrote a script which they could implement in factory software, and validated the reliability of this measurement method.
This specific calibration was tricky because it measures off of a consumable component - I determined the statistical spread the consumable build platform introduced when installed in a printer and used this to further inform the calibration.
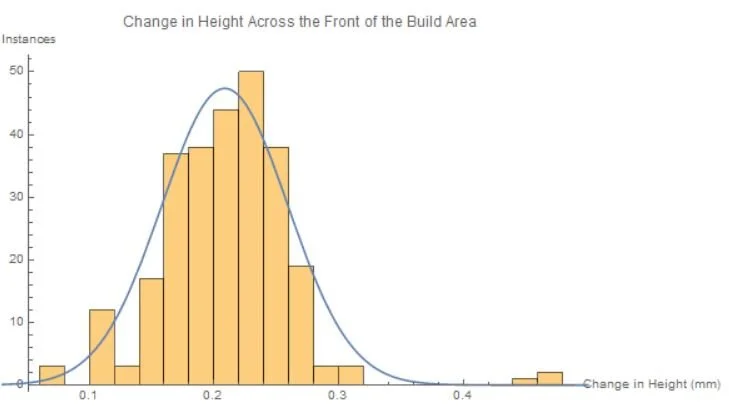
In order to characterize the spread introduced by the consumable build platform, I ran a study to look at the offset in parallelism measured on a large series of build platforms. This information allowed me to modify the factory test and the specification to better assemble our printers and lead to more print success in the field.
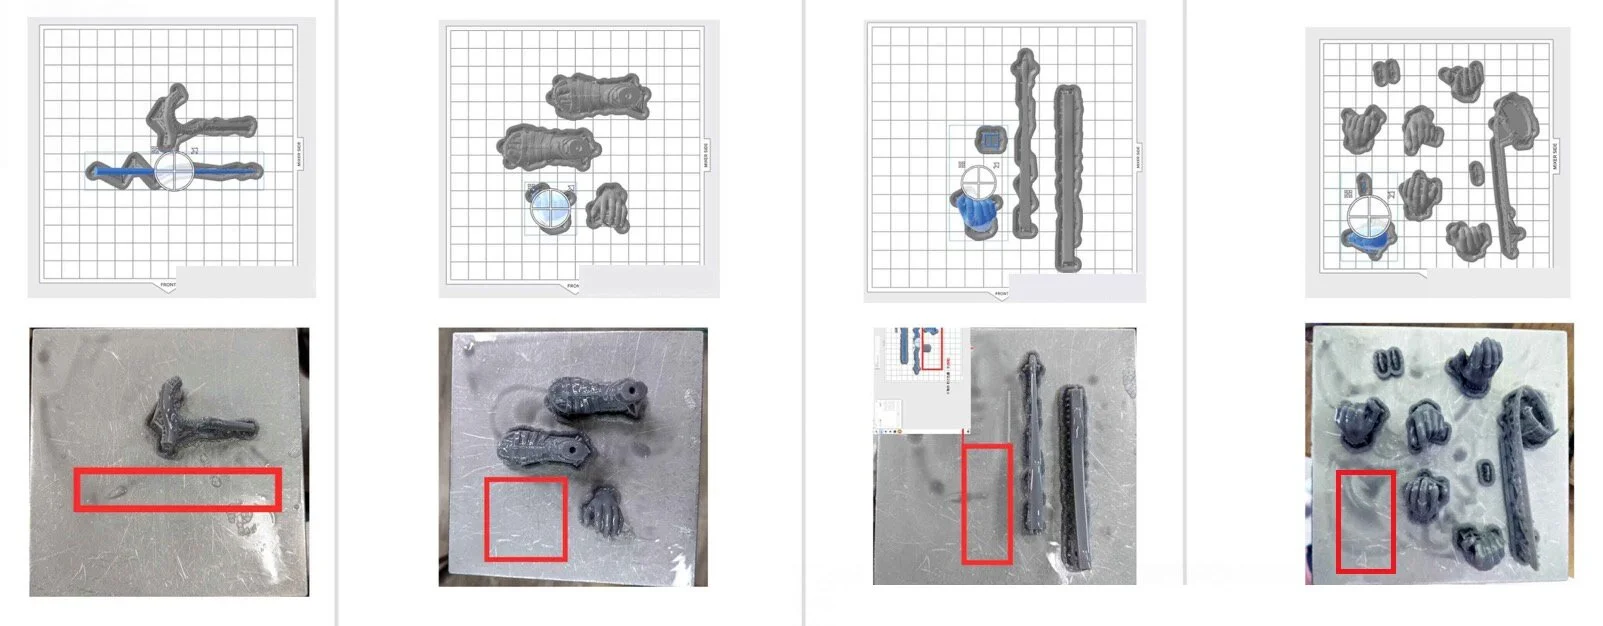
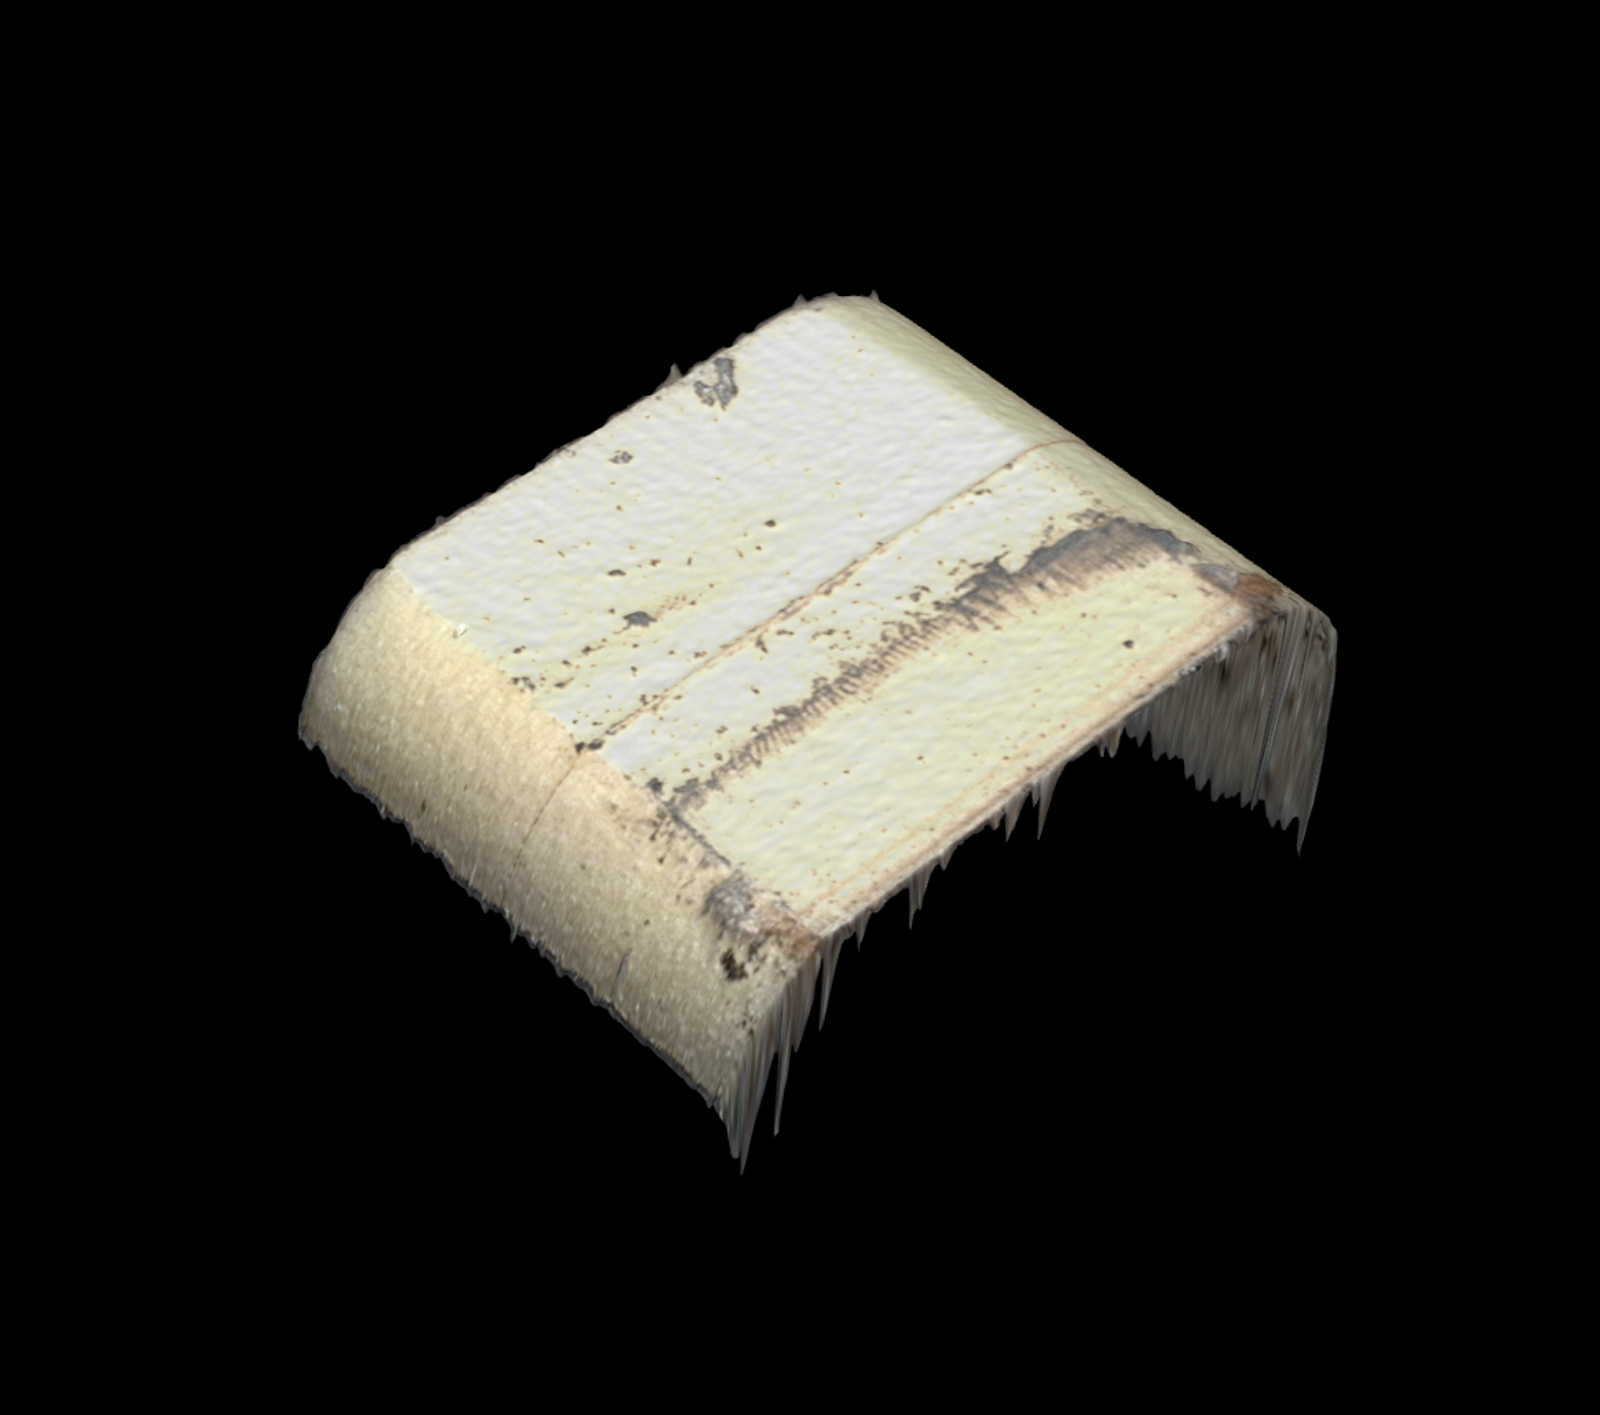
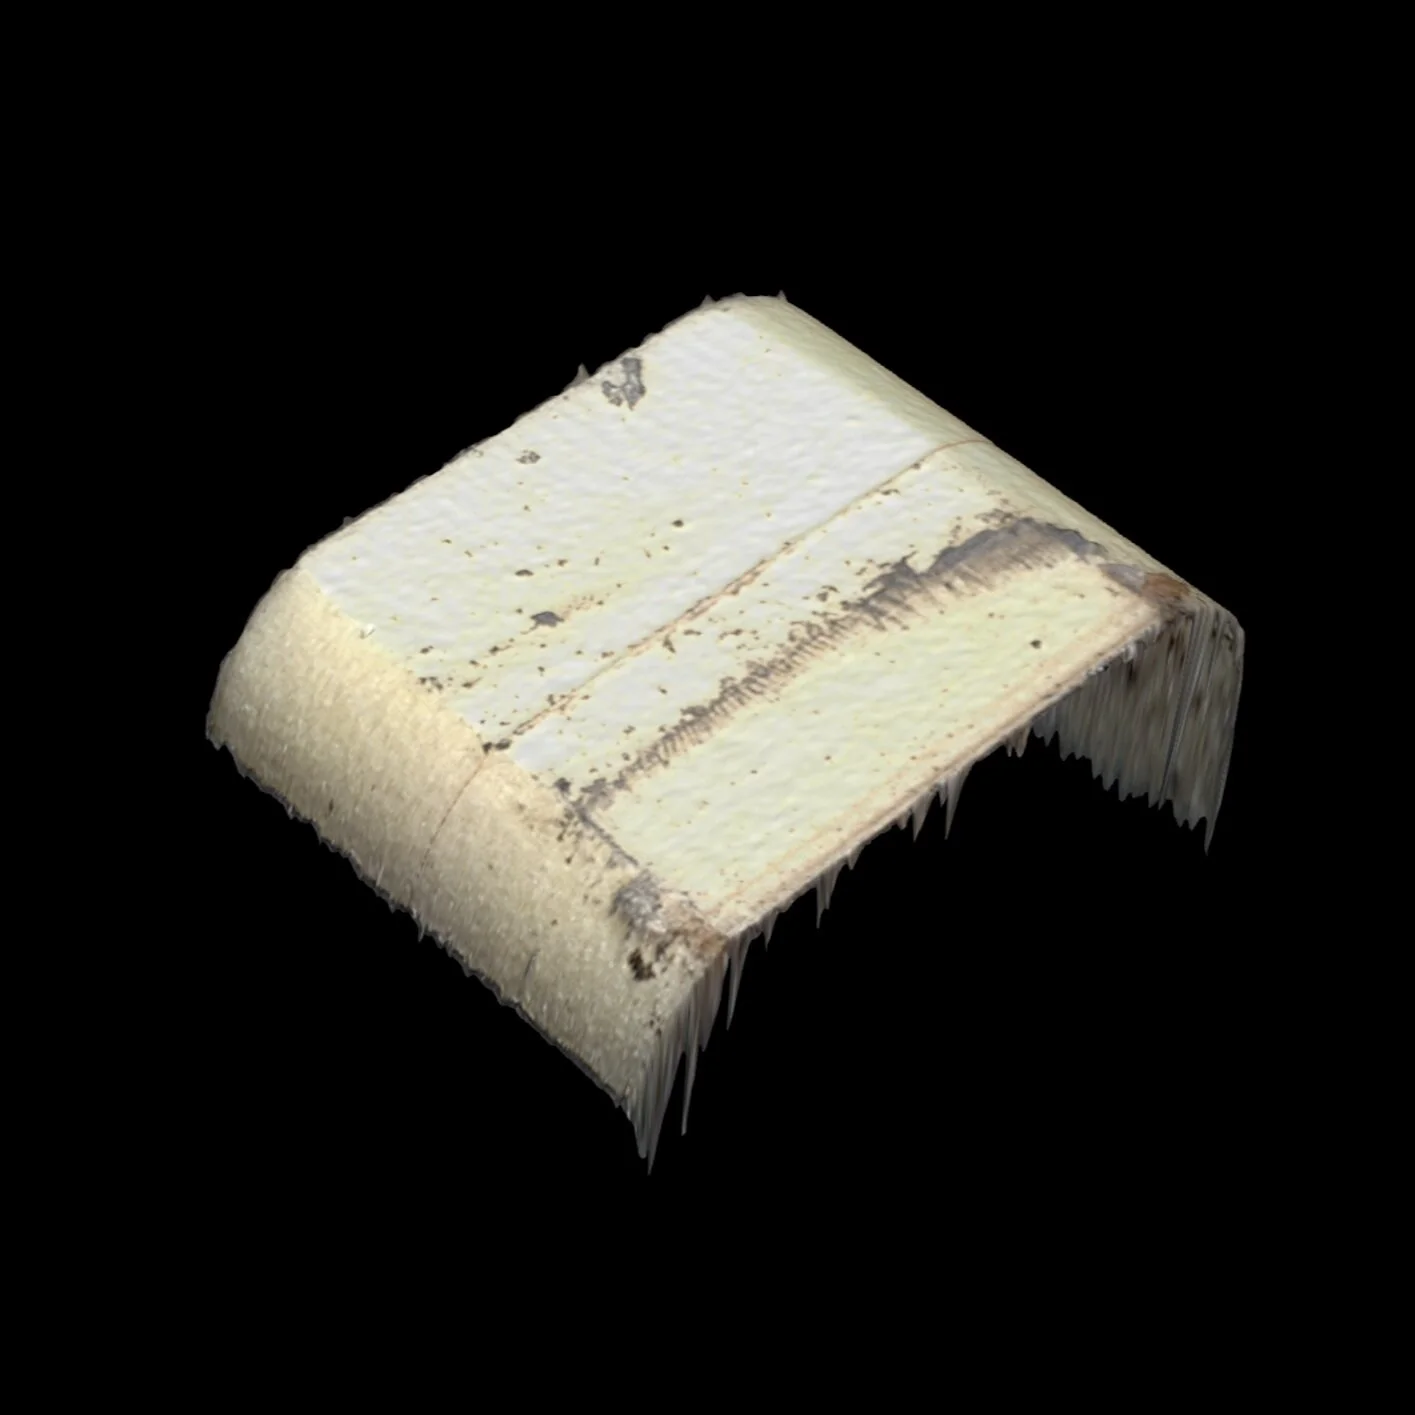
When a printer does not hit the calibration setpoints, the parts will form with poor surface quality and in extreme cases, the parts will fail to form at all. As part of my work, I ran several studies to determine what the limits of our hardware setpoints were. In this image are several prints which did not fully form as a result of poor calibration.
In many cases, the result of poor calibration is not catastrophic failure but instead degradation in surface quality. To make decisions about what mechanical setpoints were acceptable, I had to run studies making incremental changes to the hardware, qualitatively evaluate the prints, and then determine what surface quality was acceptable in the field.
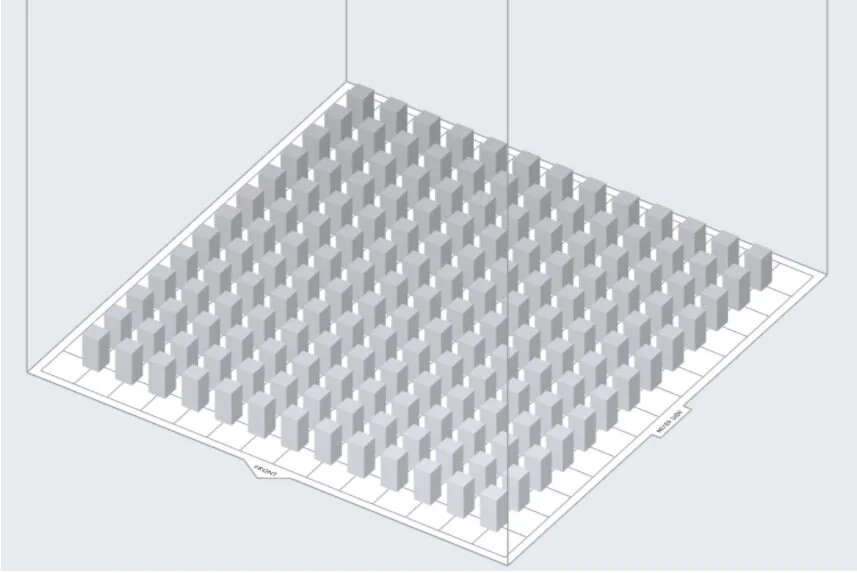
In addition to creating these hardware set points, I worked to design a test print which could be run on each printer at the factory. The point of this print was to ensure that it was printing according to expectation after assembly - and so each component on the print was meant to induce a different potential failure mode.
I wrote an SOP for analyzing each print so that it could be used as a standard. This was a challenge since print quality inspection is inherently qualitative, but I added as many quantitative metrics as possible. This test print allowed us to check that the printer was behaving as expected after calibration.
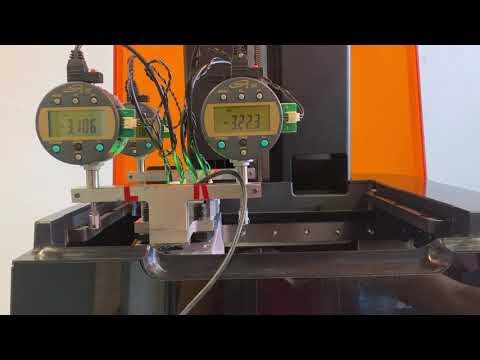
This video shows one of the calibration routines running. The rig is a revision of one I proposed designed by our manufacturing team for factory use. It is running a script I wrote to measure the height of the hinges on the left and right.
The purpose of this study was to root cause and eliminate a pervasive print quality issue in which each layer of a print was misaligned with the last. This caused cloudy surface and very visible layer lines. In order to eliminate this issue I traced it back to a non-repeatability of motion in the printer hardware and then proposed a non-invasive hardware solution.
To begin this study, I modified the script for one of the existing calibration rigs - instead of measuring off the four extremes in each corner I hoped to get a more complete image of the behavior of the system by measuring incrementally across the whole range of motion.
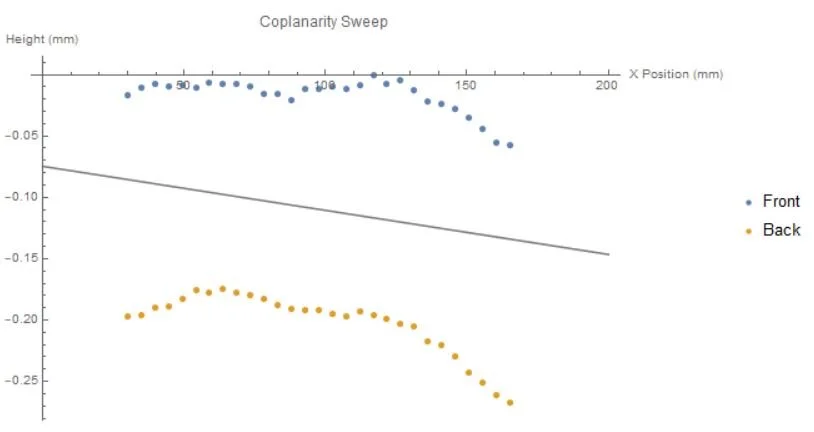
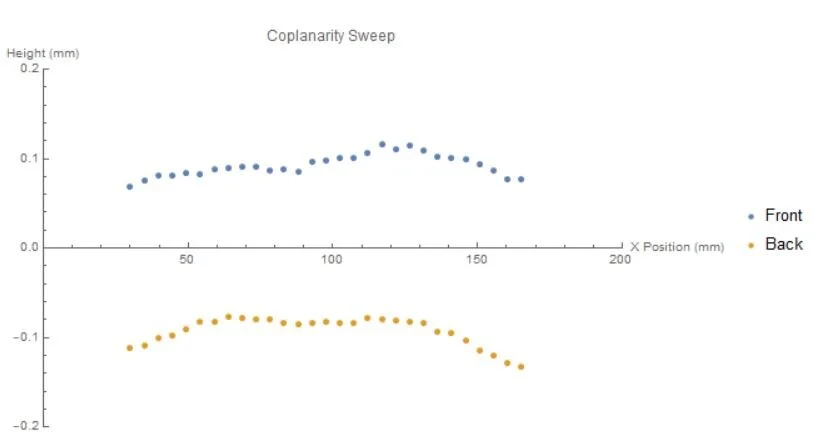
This study yielded the interesting result that the path of the laser module during printing was not flat, as expected. Instead it showed an arcing motion.
In order to explore this phenomenon more fully, I had to flesh out my data analysis process. The difficulty was in eliminating the skew inherent in the system - which was irrelevant to the study (and masked some of the arcing behavior) and in creating a direct comparison between the front and back dial indicators.
To start, I used a zeroing block to ensure the dial indicators were calibrated to the same height. This created a direct relationship between the front and back readings.
I created a skew correction by find the line of best fit for both data sets and then rotating it (and all the points) until the line of best fit was horizontal. More information on this technique can be found at Math Stack Exchange.
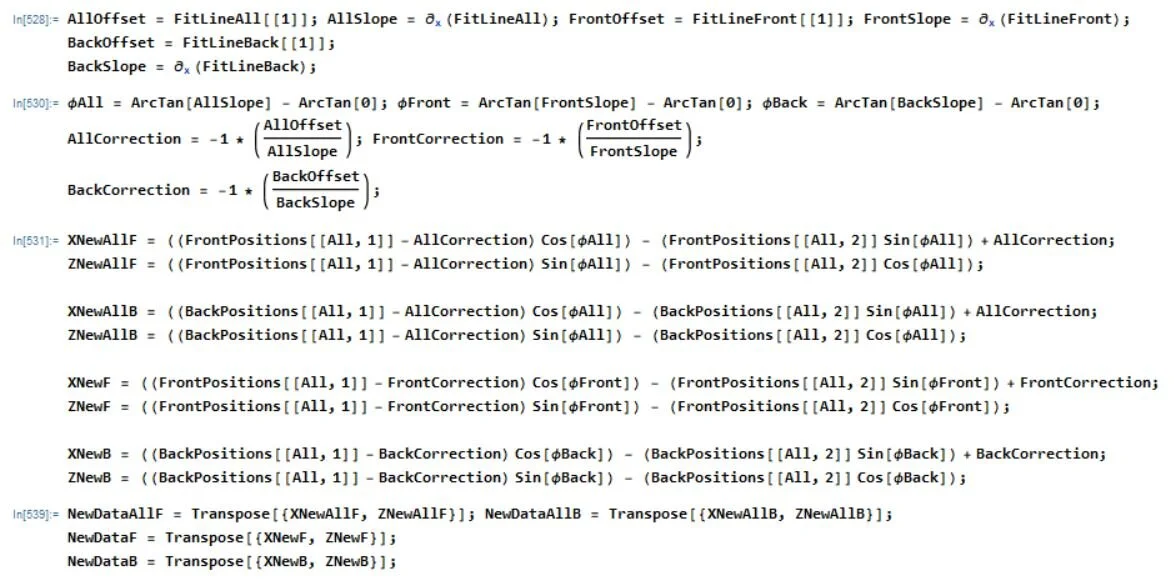
The skew corrected plot showed the behavior of the system more clearly.
Completing this data correction allowed for better comparison across different hardware configurations - in this case it is now clear that the front and back of the printer are behaving in different ways.
After analyzing the shape of motion in different configurations, I decided it was necessary to get a more in depth idea motion in the system. I proposed an experiment where an optical profilometer was attached to the moving laser module of the printer, and measured a patterned surface. After each layer, the output from the profilometer could be compared both vertically and horizontally.
This experimental setup now captured motion in both X and Z, as well as repeatability between passes.
The final experimental design.
A close up of the profilometer and the surface it was measuring. Each layer was printed in the area between the ‘landmarks’ placed on either side of the profilometer. These were used to ensure that we retained good x-alignment in data processing.
Screenshot of output from profilometer showing the x-height measurement for one layer.
I wrote a Mathematica program which processed all of the profilometer output during a print as well as the print log from the printer. The program took the X-position and time from the printer and compared it to the heights read by the profilometer. This plot shows 10 layers stacked on top of each other. Noted that in this case the X-axis represents time and the wider bumps in the plot correspond with slower motion.
This plot shows the profilometer height on a much tighter scale. It is now much easier to see the differences in height measured by the profilometer between layers.
This plot is shown on the same scale as above, but with a hardware component from the printer removed. This greatly reduced the amount of mechanical noise between layers.
In order to permanently reduce the noise observed above. I worked with several mechanical engineers to propose a new component to replace the rolling cam follower which was the root of the problem. The replacement is a sliding IGUS-J ‘Cam Slider.’
Cam slider testing showed that it was easy to replace in field, had good wear-in characteristics and lasted for the lifetime of the printer without wearing down.
This Keyence image shows minimal wear after hundreds of thousands of cycles.
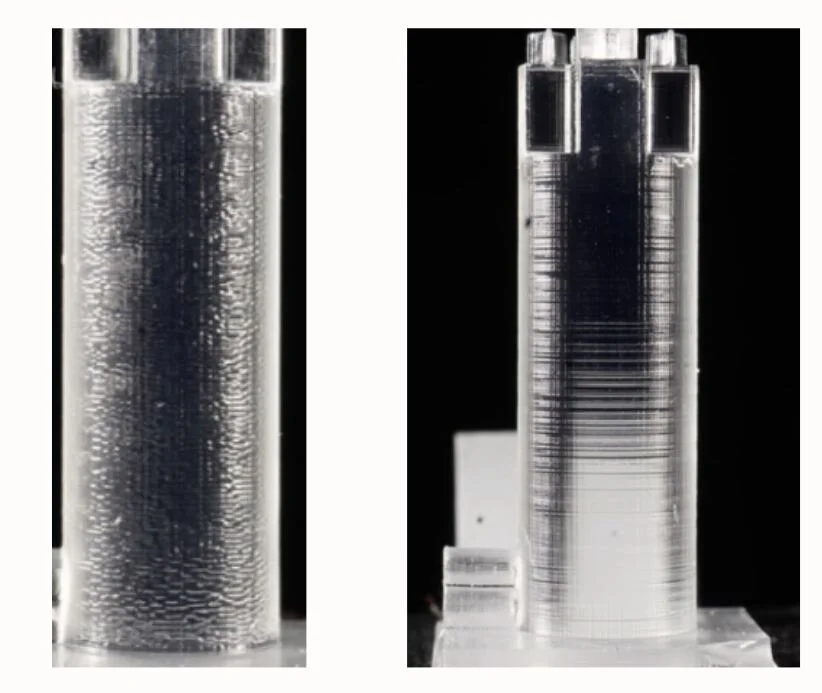
The improved repeatability between layers created a much better surface finish on our 3D printed parts.
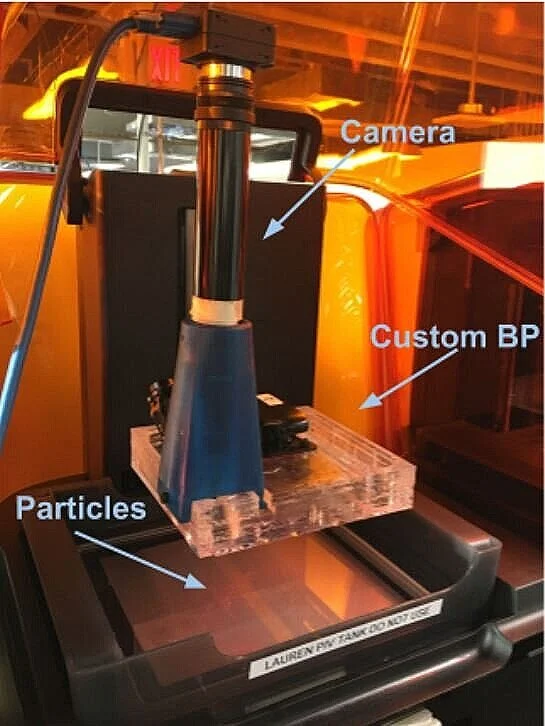
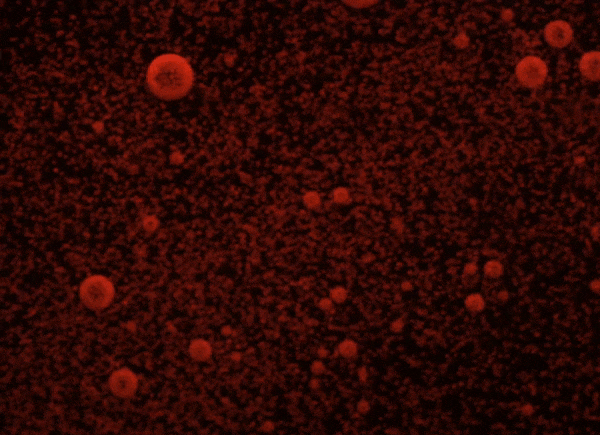
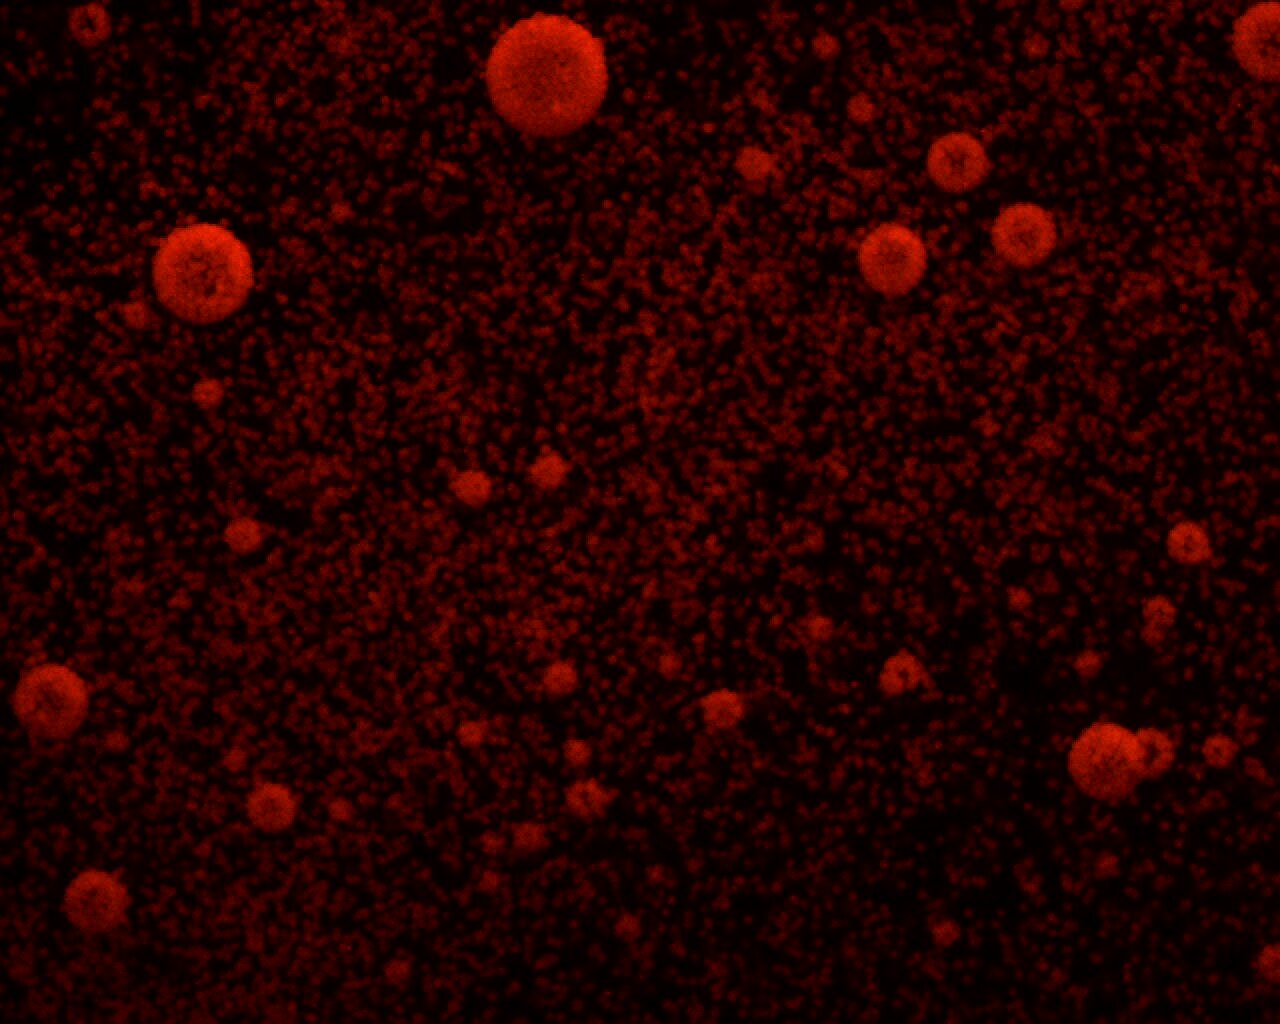
In order to better understand the motion of resin during printing, I set up a particle image velocimetry system and corresponding data processor to determine if and how fluid flow affected the quality of our parts.
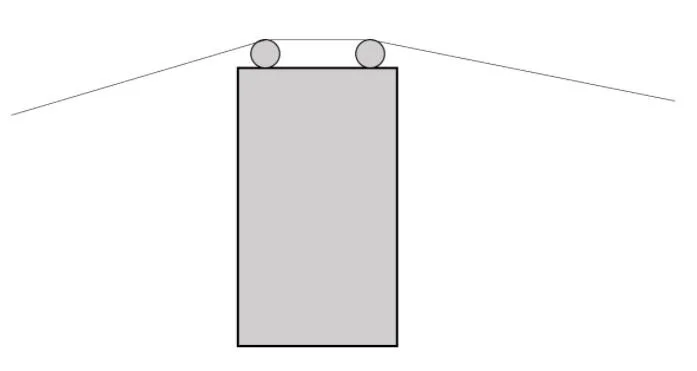
In order to see the motion of the resin, I used fluorescent particles and flashlight with wavelength light corresponding with the peak fluorescence of the particles. In order to closely model the behavior during printing, I used a clear acrylic camera mount with the same geometry as our standard printing surface.
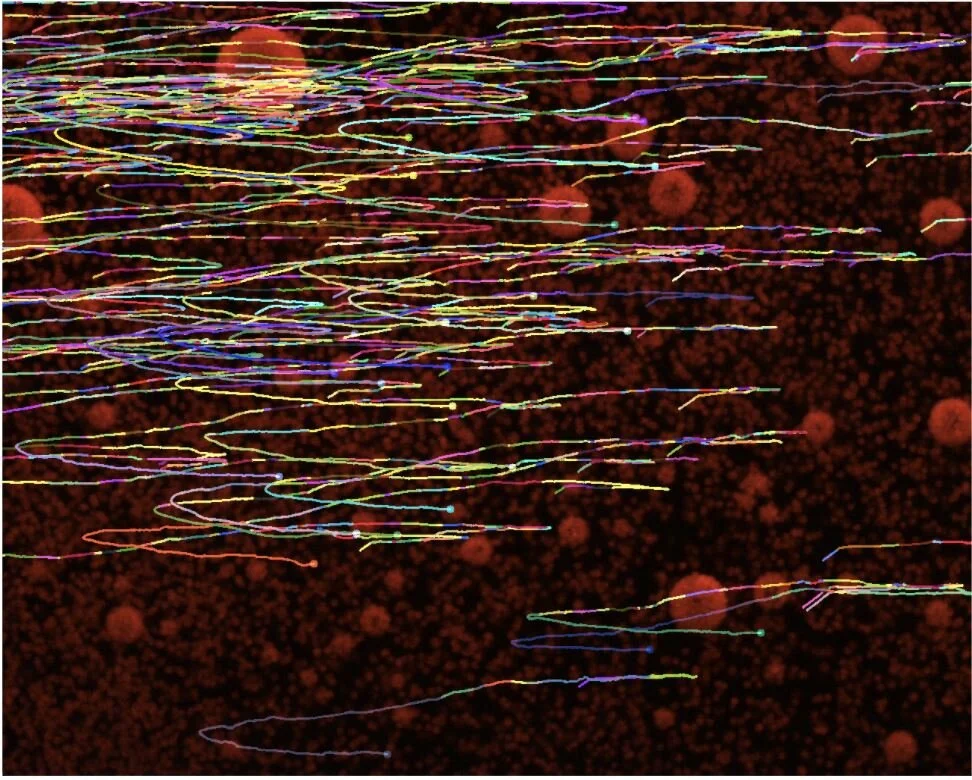
Example video of particles floating in the resin while the laser module moves underneath. Note that the large ‘particles’ are bubbles in the resin.
To process the video I used and modified the OpenPIV software repo. Each path shows the motion of one particle over the length of the video.
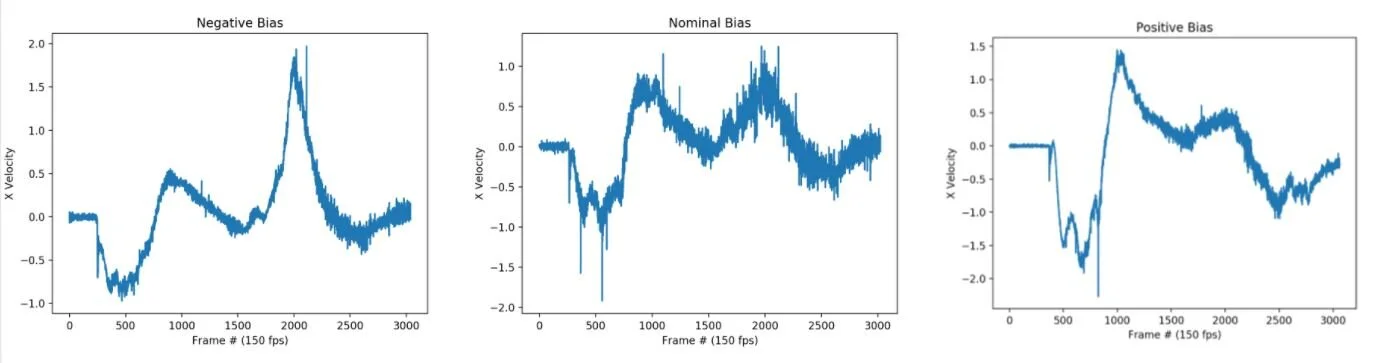
Data further distilled from the videos shows the velocity of the particles over time for three different hardware configurations.
Example video of particles moving while a cylinder is cured by the laser.
Another processing sample - shows the relative velocities of the resin moving around a cylinder as it is being printed, as in the image shown above.
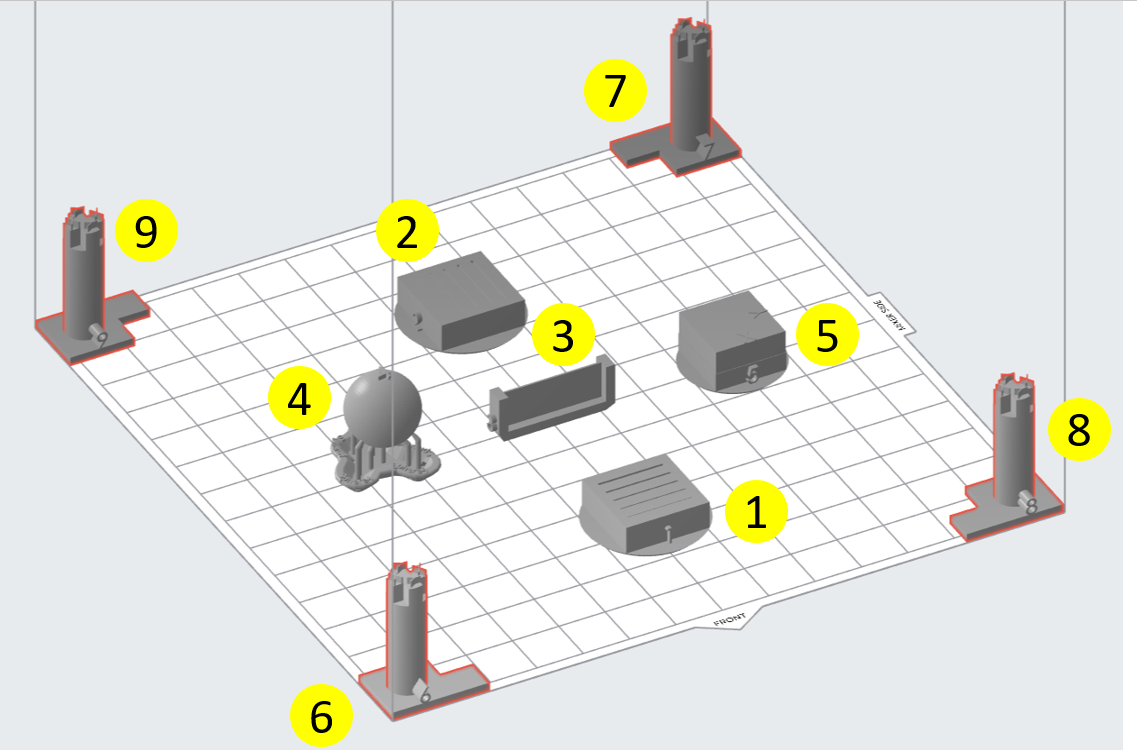
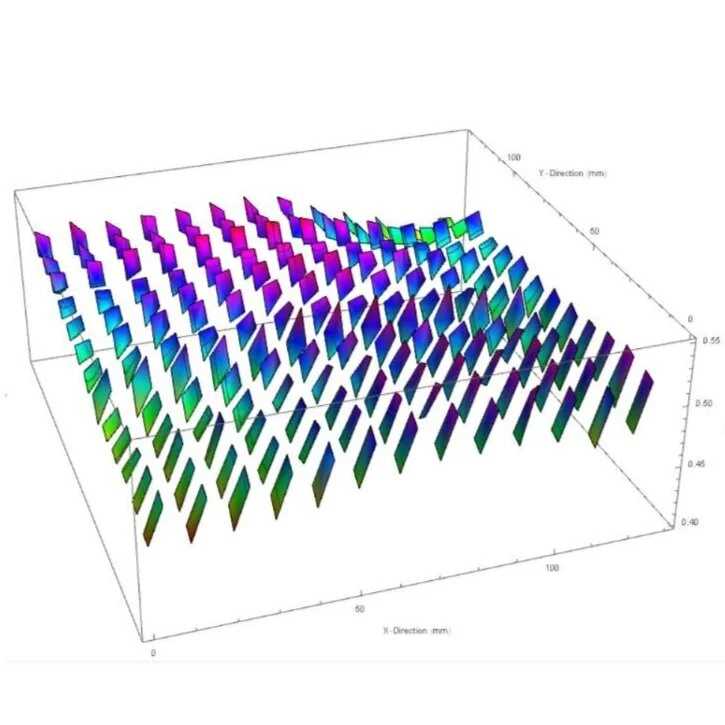
In order to better understand how the soft film influences the final shape of a print, I designed a print, took measurements and analyzed data to determine how a part varied from an ideal flat plane.
This shows a print designed o look at the shape of the cure plane. The size of the rectangles is designed such that the would not over-compress the film and change the shape, and also to wash out any affect form the platform the parts are printed on.
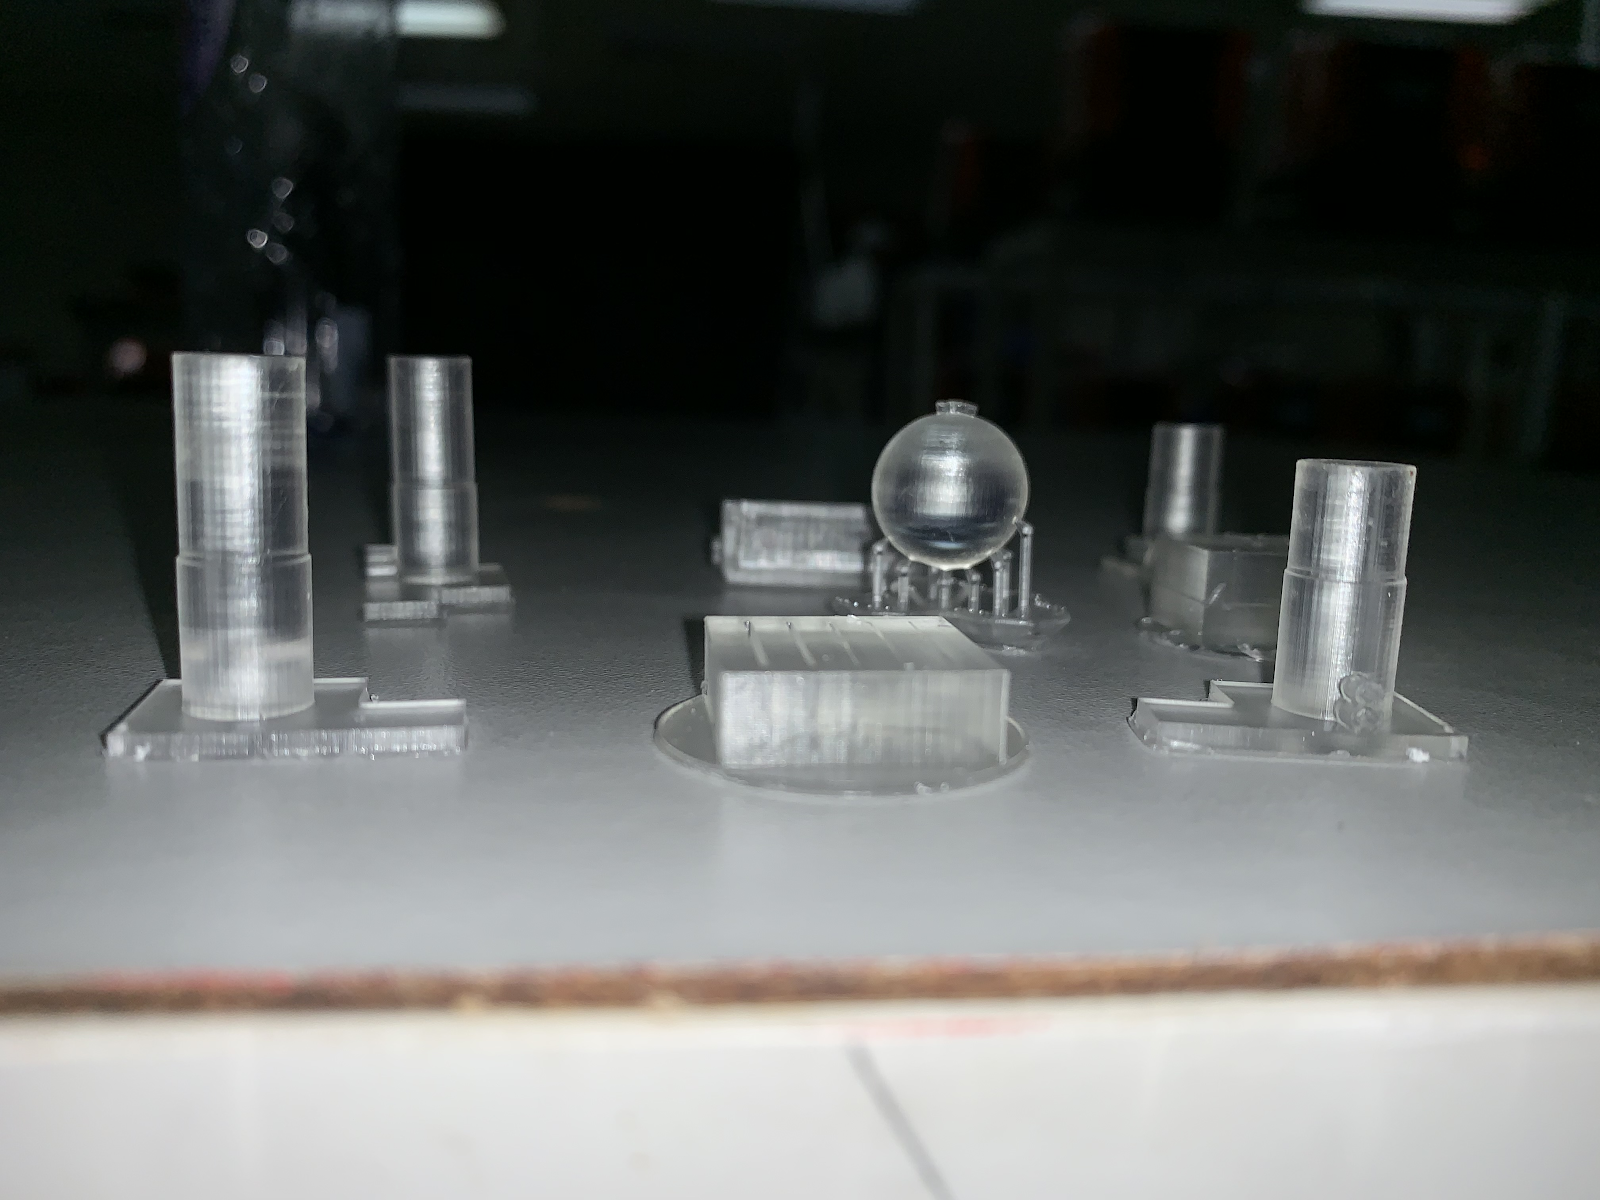
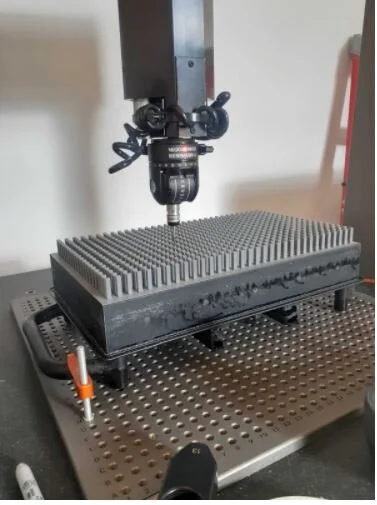
I wrote a program on the coordinate-measurement machine (CMM) to measure the height of each of the pillars in five locations (each corner and the center). This presented some challenge in correcting for inaccuracies in dimensional accuracy across the print area, especially since the process was impractical to do manually with so many individual pillars. However, the time I spent automating this process allowed other members of the team to continue to gather larger data sets, such as this print above from a much larger build area.
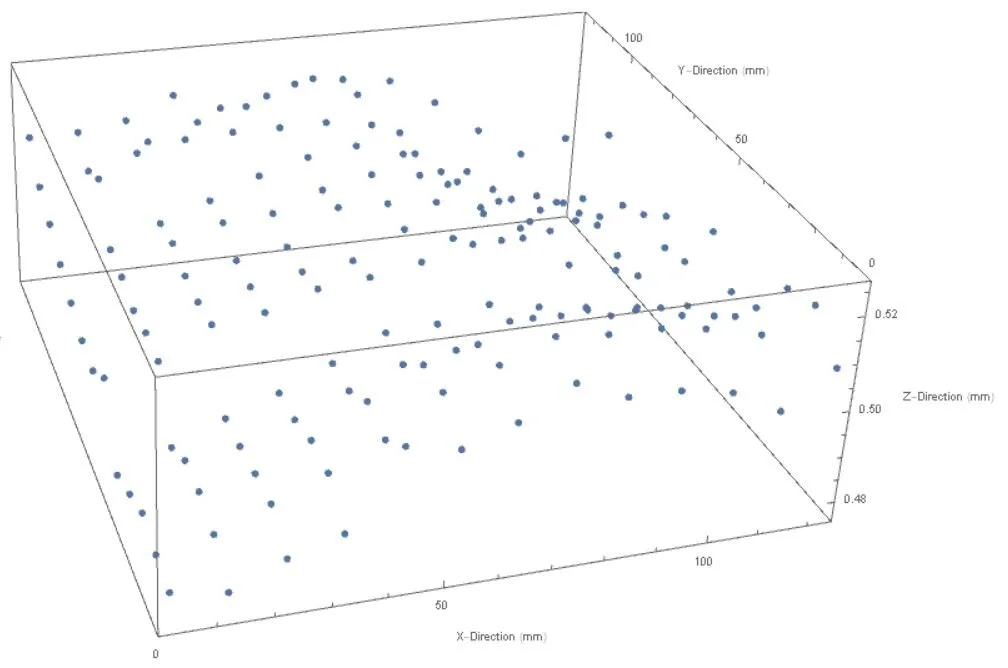
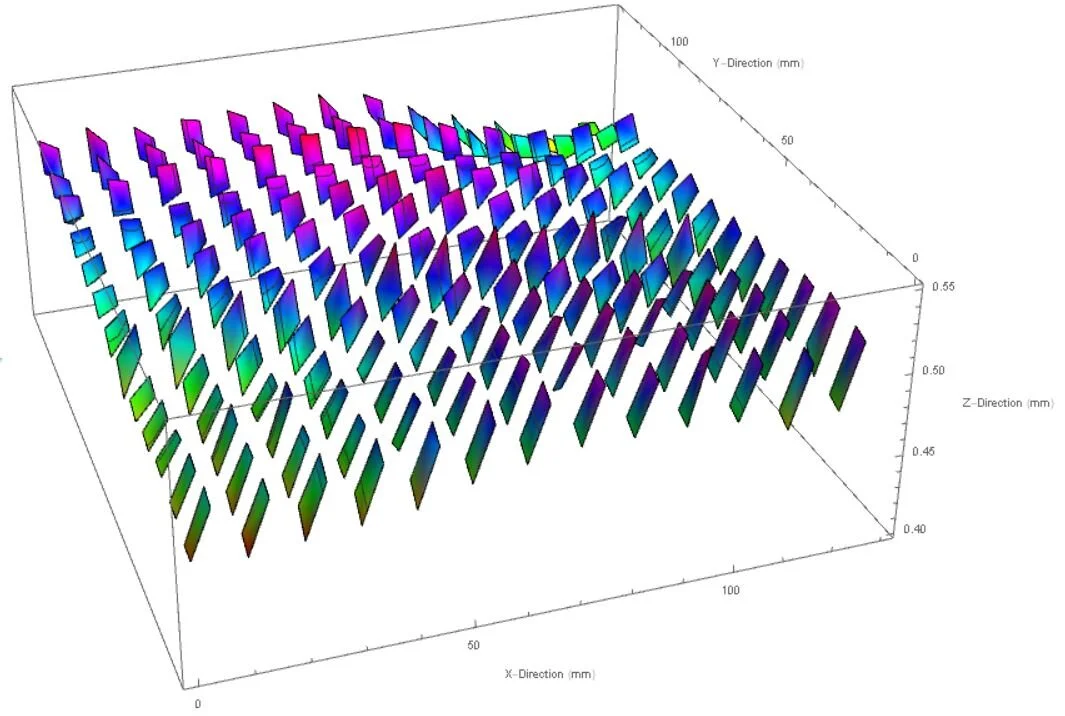
This plot shows the changes in the height of the centroid of each pillars top surface across the build area. To create this data set, I had to read the output point cloud from the CMM and translate those coordinates into something simple enough for plotting. This allowed for better visualization of how our prints varied from a perfect plane.
This plot shows how the shapes of the tops of the pillars changes across the build area. To get this visualization, I binned the point cloud data by groups of points which make up one pillars and plotted the local planes. This lends insight into how the shapes of small parts change across the build area.
In addition to measuring prints, I took used an optical profilometer to measure the shape of the film itself.
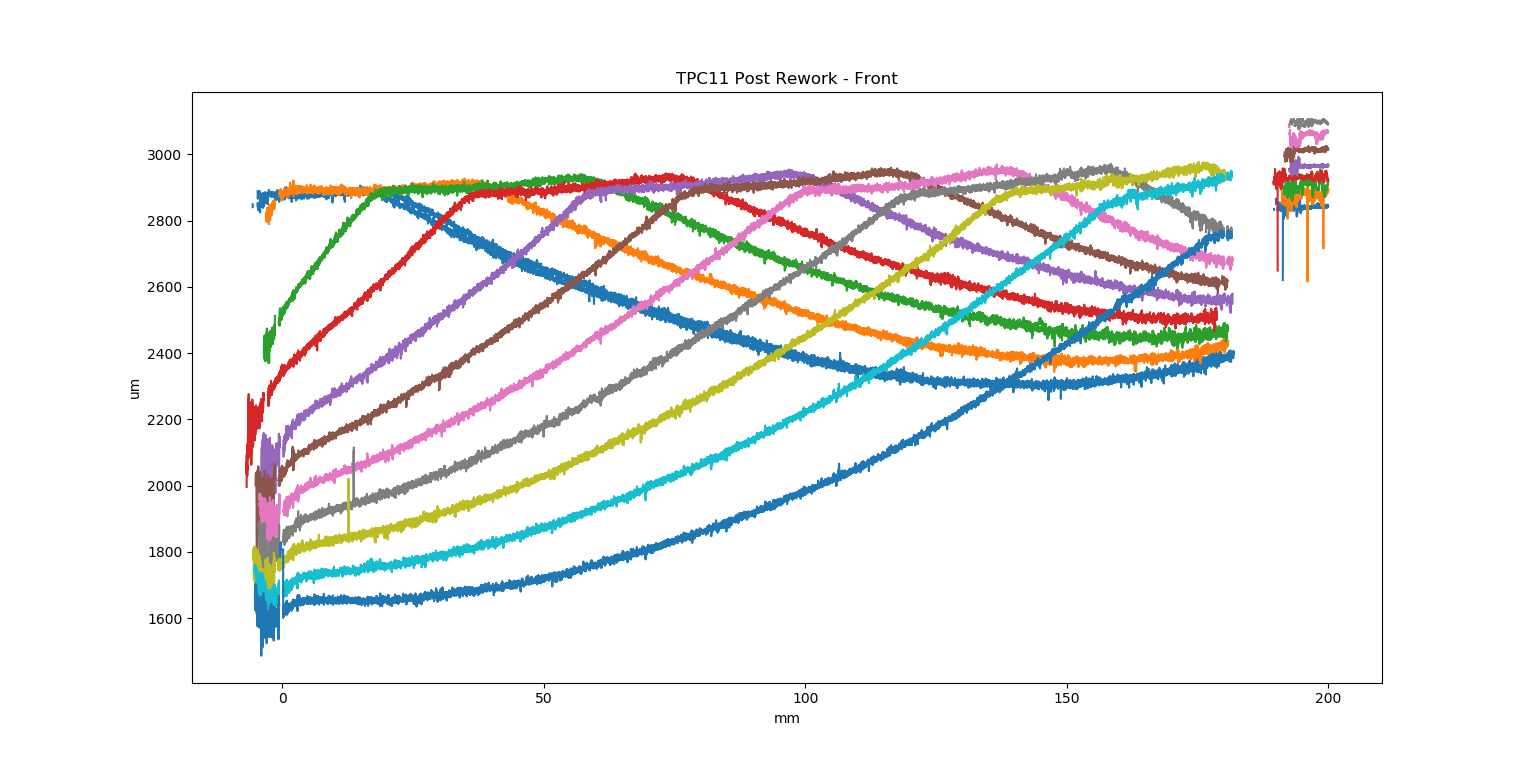
This plot shows the shape of the film as the roller holder moves from left to right (each color represents a different position). To take this data I used an optical profilometer mounted on a linear stage, and measure downward onto a film. Processing this data required combing the data from each location, locating them with respect to each other in X, and applying a skew correction.
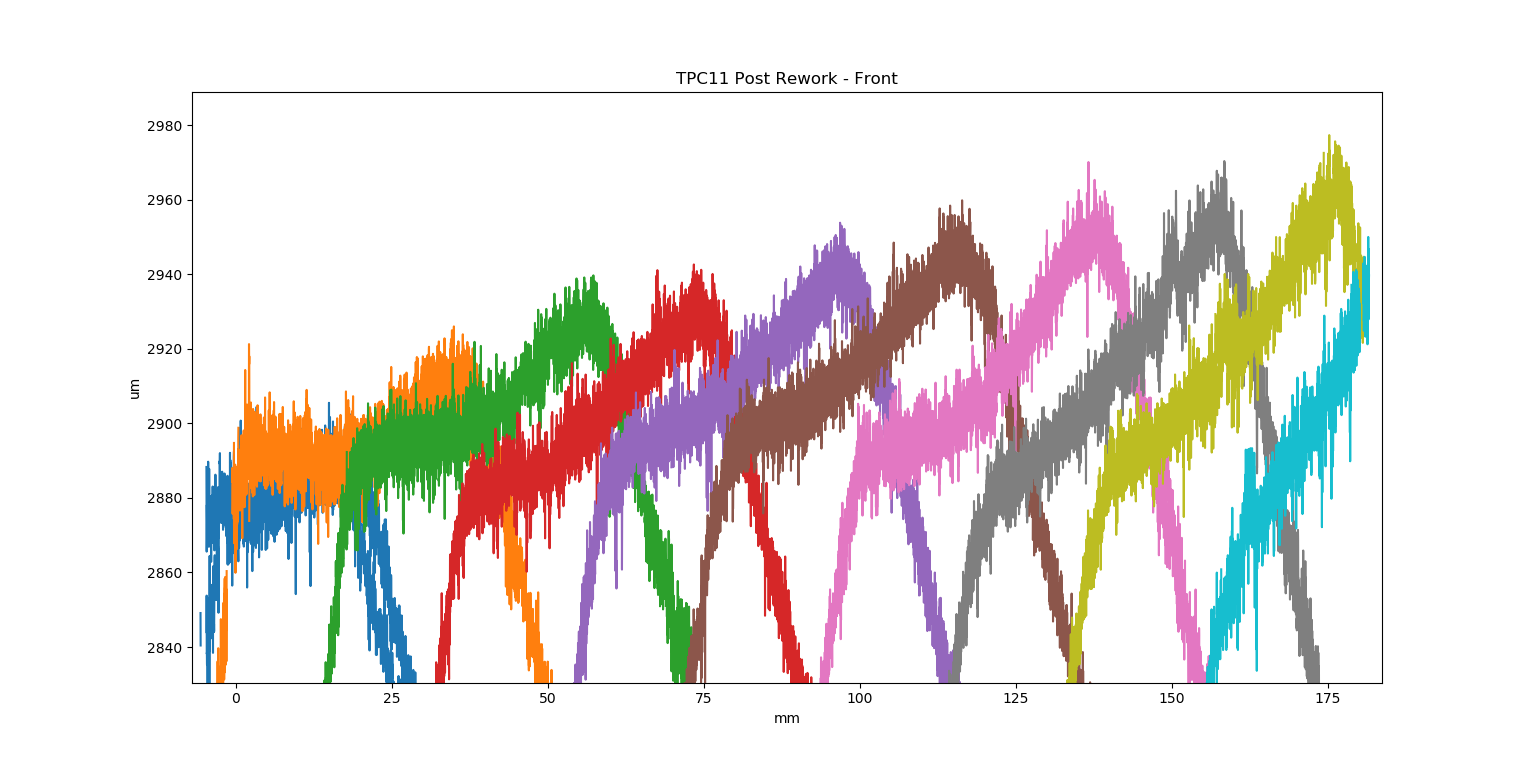
This image shows the same plot as above on a tighter axes. This view allowed insight into how the shape of the film changes as the laser module moved from left to right.
The purpose of this study was to characterize the spring constant in different locations on our film tank. By finding the areas with the highest spring constant, I hoped to determine whether the print forces were higher and if that was affecting the print quality.
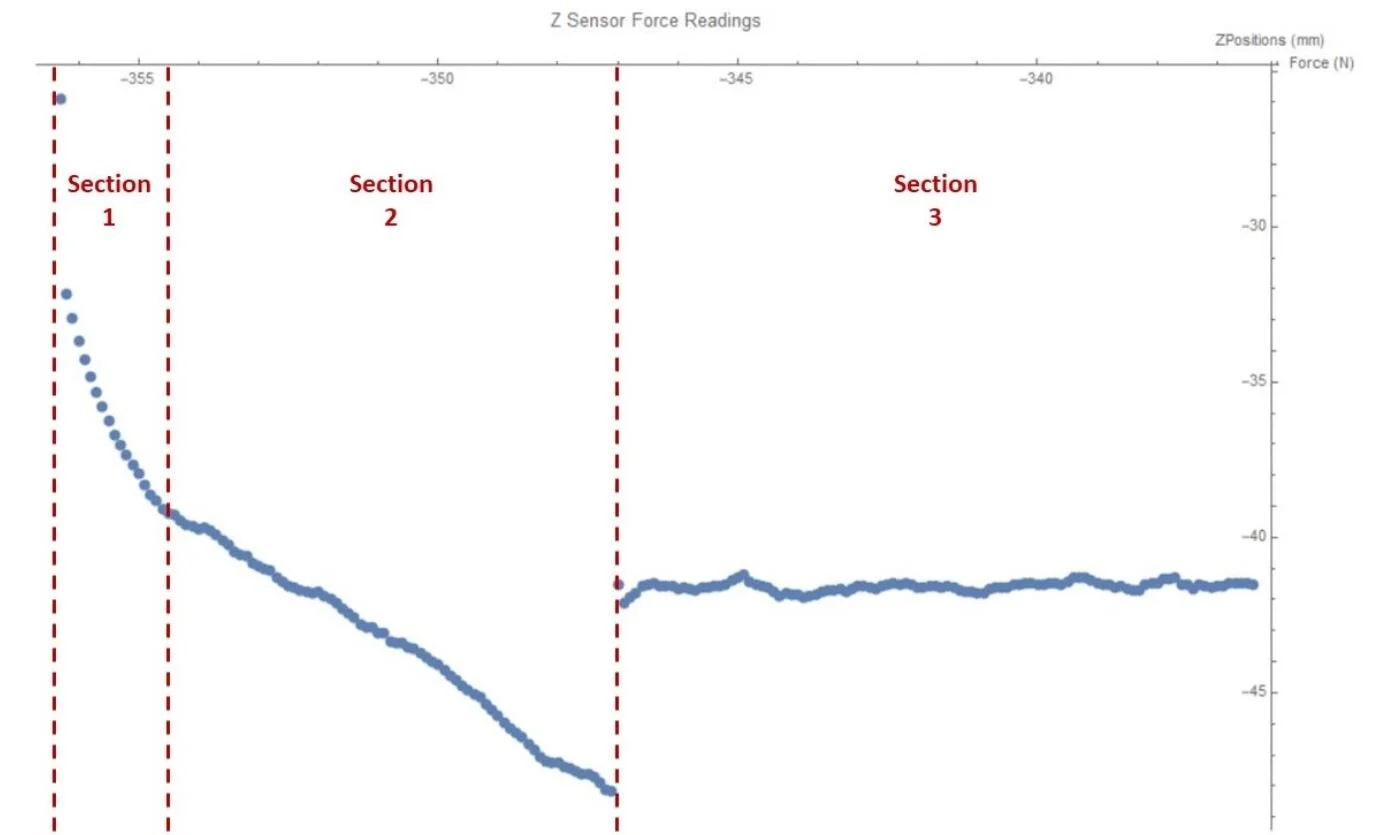
This experiment consisted of a steel sheet on a build platform paired with a magnet under the tank film. I used the force sensor built into the printer to measure the amount of force needed to break contact with the magnet.
This plot shows the force v. displacement for one example. In Section 1, the magnetic plate was still resting on the film. In Section 2, the plate is not resting on the film, but is starting to experience the downward pulling force of the magnet trapped under the film. In Section 3, the magnet breaks contact from the plate and a constant force is seen (representing the weight of the build platform).
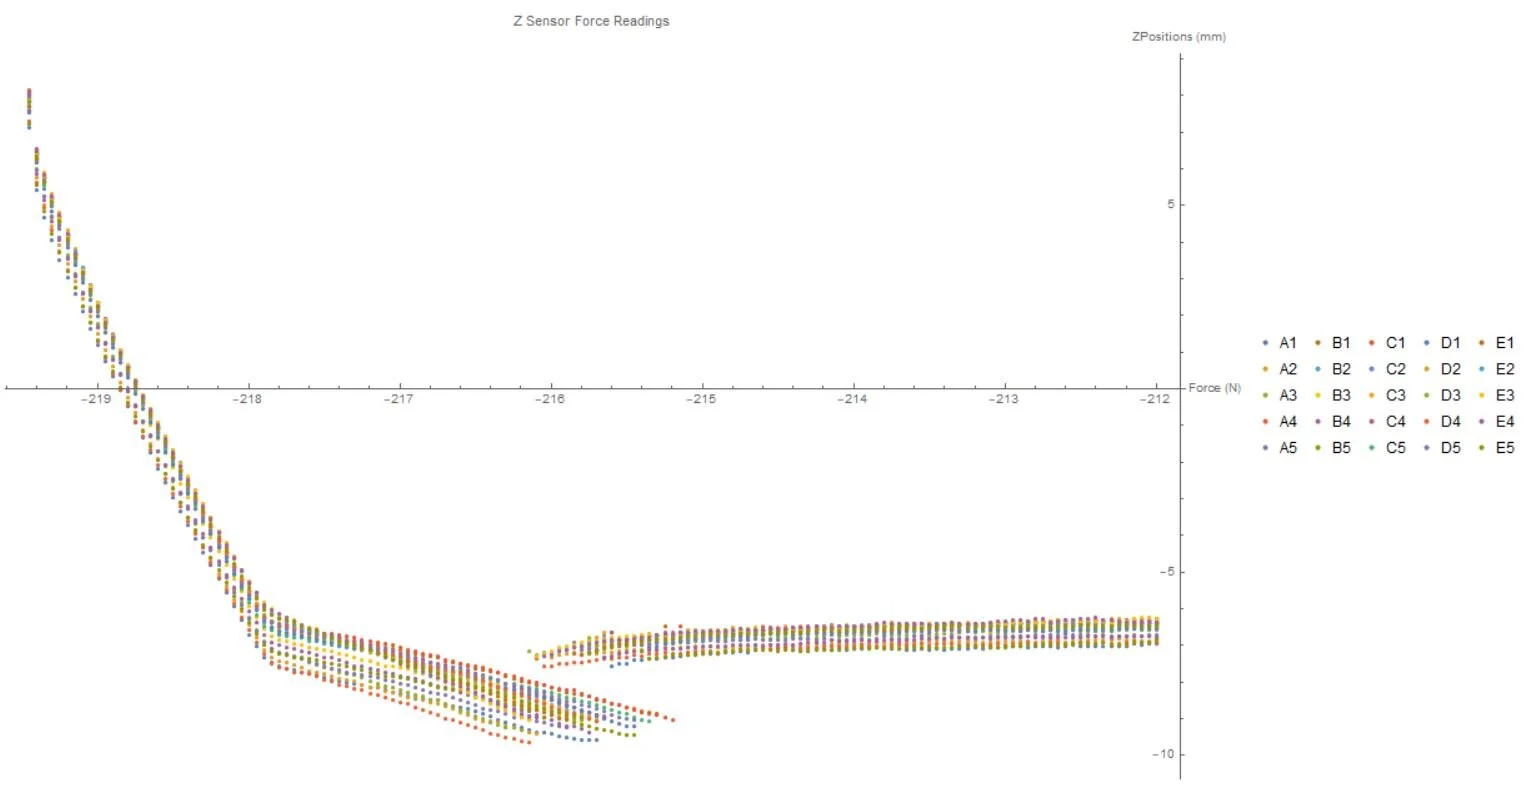
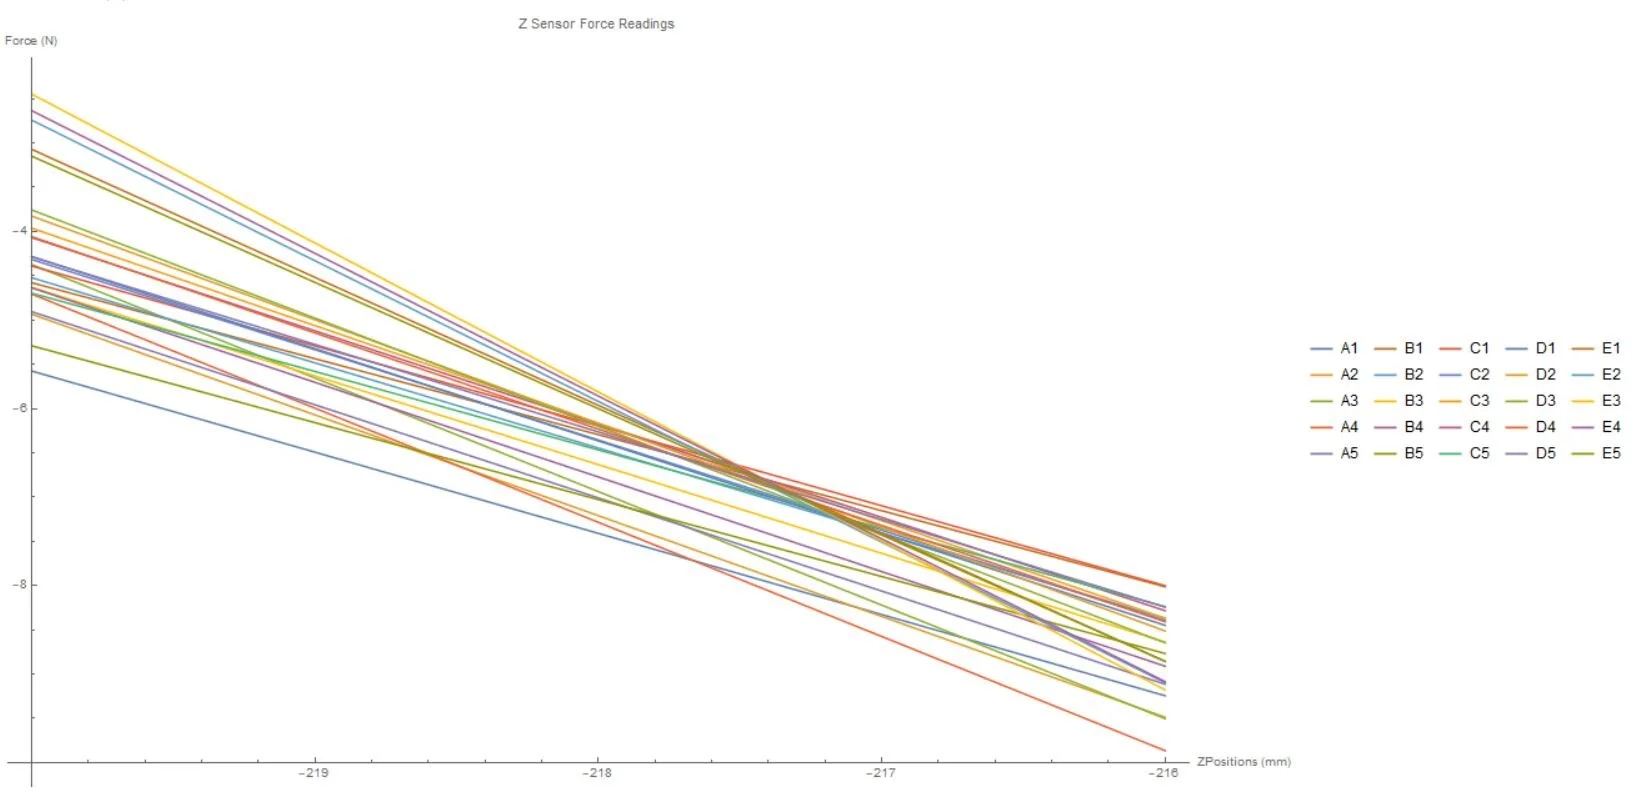
In order to take local spring constant measurements, I repeated the process in many locations (shown in the tank in the first image). For each measurement, the linear behavior shown in ‘section 2’ is of interest.
This image shows a line of best fit plotted for each local data set over the area of linear behavior.
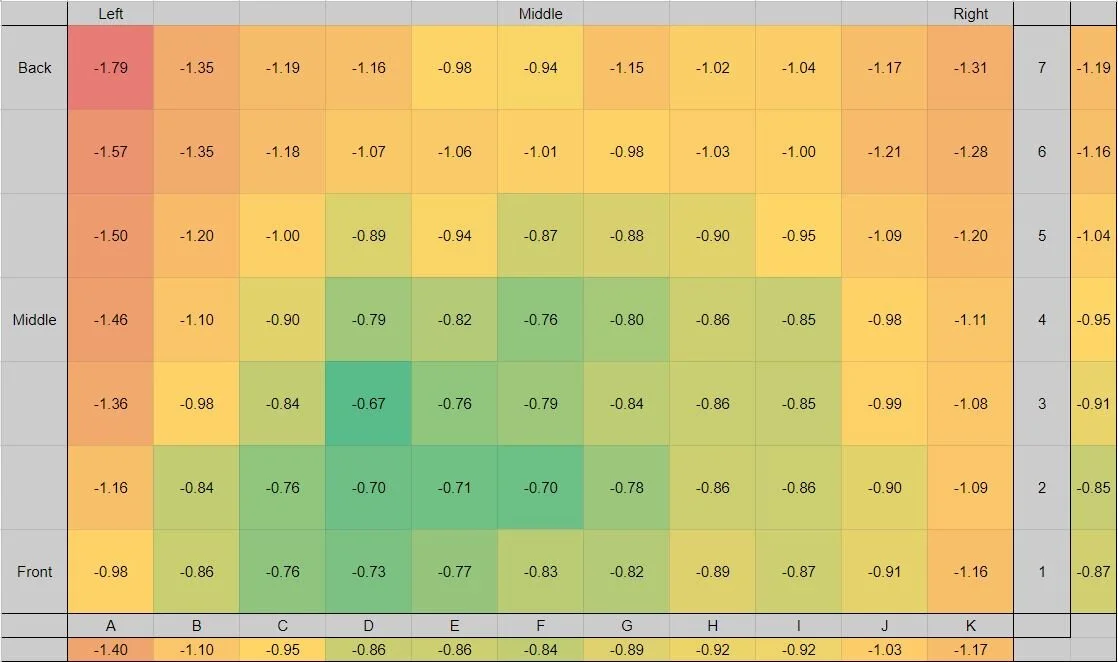
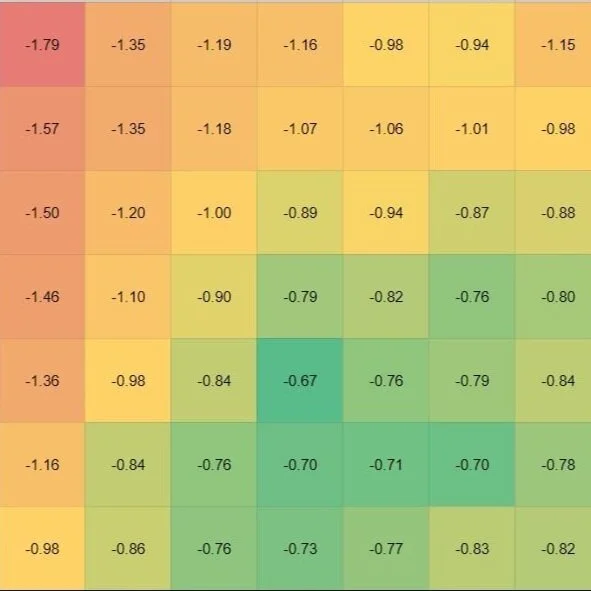
This plot shows the slope of each of the lines of best fit plotted into its area on the tank. (Note this is a larger tank than the one shown above.) This indicates that the tank has the lowest spring constant in the front mid-left location and the highest at the back left location. With this information, we can start to better understand discrepancies in print quality in different locations.
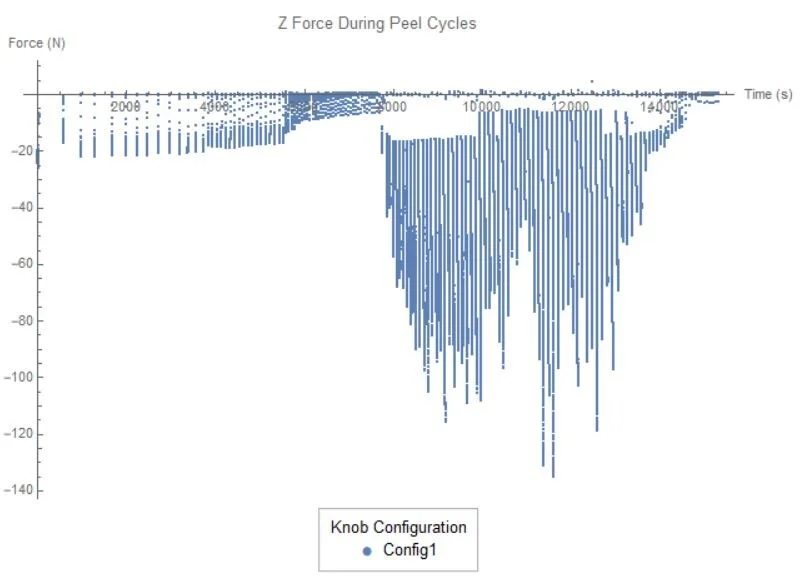
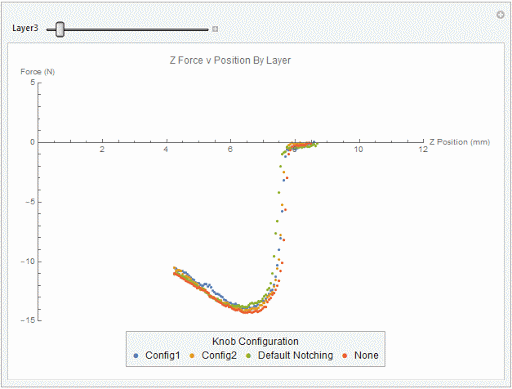
Over the course of a print, the part experiences changing forces, the highest forces being when a part is removed from the film to start a new layer. In order to optimize printing, and increase my understanding of these forces during printing I wrote a Mathematica script which plotted the internal printer forces over time.
This shows the internal all forces during one complete print.
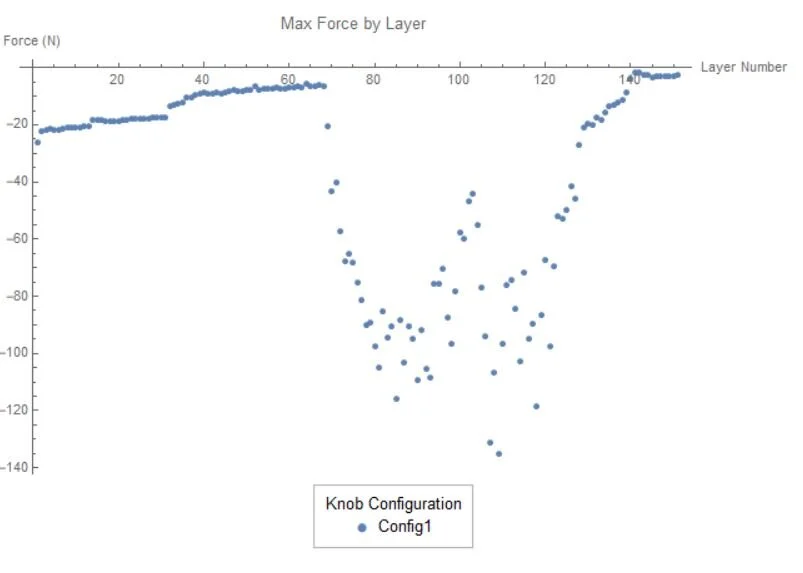
This plot shows the maximum force for each layer printed.
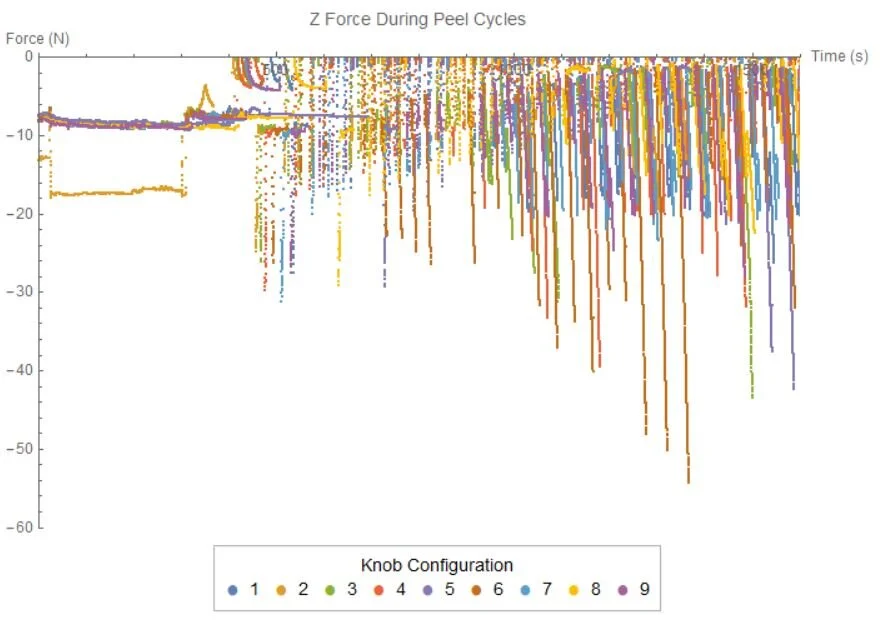
In order to help optimize software parameters, I plotted multiple prints on one set of axes - however with 9 prints it is a little too noisy to make out anything meaningful.
This GIF shows the peel force for each individual layer. This allows for direct comparison of behavior for each software configuration.